The Statistics screen
The report of the work on each field, block by block — and the menu that chooses the active field, shows the lifetime mileage and erases a field.
The Statistics screen is the report of the work: how far you drove, how much you covered, what was sown and how evenly. It is kept separately for each field and survives switching off. Open it with “HOME” from the Seeding table (twice from the home screen); “BACK” returns to the home screen, “HOME” goes on to the next working screen.
The report is one long list. “UP” and “DOWN” scroll it one line per touch; “PLUS” and “MINUS” show the next or previous field. On the screen itself, a swipe up or down scrolls, a two-finger swipe changes the field and a two-finger tap opens the menu.
The head and the work on the field
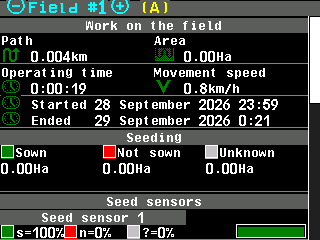
- Field number, between the signs of “MINUS” and “PLUS”.
- (A) — this is the active field, the one the panel writes to now.
- Path — distance driven while seeding, in km.
- Area — area treated while seeding, in ha.
- Operating time — time spent seeding.
- Movement speed — the average speed while seeding.
- Started / Ended — when the work on this field began and ended.
- Seeding — the area sown, not sown and unknown.
- Seed sensors — one block per sensor follows.
- s, n, ? — the share of sown, not sown and unknown area for this sensor.
- Bar — the same shares in colour: green sown, red not sown, grey unknown.
- Scroll bar — where you are in the report.
Unknown is area driven while a sensor had no connection or was out of control. In the “Flow” mode, not sown is the area where the sensor saw no flow; in “Precise” it is the area of one skip times the number of skips.
Blocks you may also see
| Block | What it holds |
|---|---|
| Products by weight | Per product: the weight applied, actual against target in kg/ha and in per cent, and the distance, share and number of deviations beyond “Product rate error,%”. |
| “Work without alarms control” | Path, area and share, time and speed driven while seeding without the alarms watched — a set value too high, or set high on purpose. |
| “Speed control” | “Path, slow” and “Path, fast”: distance and share driven outside the speed limits. Only with the speed control on. |
| “Fertilizing” | Fertilized, not fertilized and unknown area. |
| Per seed sensor, in the full view | The distance, share and number of times the line ran under the alarm level. |
In the “Precise” mode
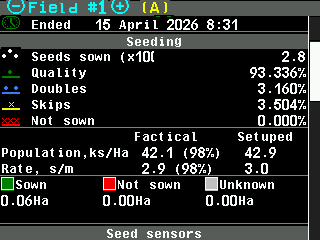
The “Seeding” block adds “Seeds sown (x1000)”; “Quality” (singles), “Doubles” and “Skips” while seeding, and “Not sown” — skips over stretches where nothing was sown — each as a share of all seeds and skips; and “Population,ks/Ha” and “Rate, s/m”, each in the columns “Factical” and “Setuped”, with the ratio in per cent. Each seed sensor adds its seeds, its quality, doubles and skips, its population and rate, and the distances it ran below and above the permitted deviation. “Seeds sown (x1000)” also appears in the other modes with “Count seeds always” on.
The actual rate counts only the path where seed flowed; the population counts the whole path. Their deviations can therefore differ.
The menu of the screen
Press “MENU”.
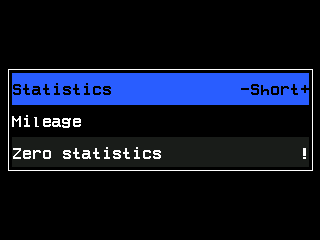
| Item | What it does |
|---|---|
| “Select field” | Makes the field shown the active one — see Start a new field. Shown only on a field that is not active. |
| “Statistics” | “Short” or “Full” view. Not shown without a speed sensor. |
| “Mileage” | Path and area over the whole life of the system; they cannot be reset. Without a speed sensor, the running time. |
| “Save to SD-card” | Shown when a memory card is ready. Firmware 2.2.8 does not save the report yet and answers with a failure message. |
| “Zero statistics” | Erases the field shown. At the Operator level the panel asks for the code of a higher level; above it, “Are you sure?”. |
Something your machine does that this page does not answer? Write to support@agriwelt.com — an engineer answers.