The section diagram — columns, lines and colours
How to read the seed and fertilizer diagrams of the Hectare Mini in the "Flow", "Hybrid" and "Precise" modes, and what "NOT UNDER CONTROL" means.
Each column of a diagram is one seed or fertilizer line — one sensor. Its height is the flow through that line now. Next to the columns, the rate field shows the measured rate on top and the set value below it; while you change the set value it turns yellow for a few seconds. How the rest is drawn depends on the mode set in “Mode of seeding” and “Mode of fertilizers”: “Flow”, “Hybrid” or “Precise”. The fertilizer diagram always stands above the seed diagram and is usually run in “Flow”.
“Flow” mode
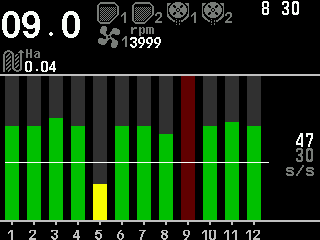
- Alarm level — the lower figure of the rate field, in seeds per second (s/s). The flow under which a line counts as failing. “PLUS” and “MINUS” change it by 1.
- Control line — the white line across the diagram: the alarm level drawn.
- Measured flow — the upper figure: the average of the lines now.
- Green column — the flow is above the alarm level.
- Yellow column — the flow is below the alarm level: alarm.
- No column — no flow at all. While the drill is seeding and the alarms are watched, the background of that column blinks dark red over its full height.
“Hybrid” mode
As “Flow”, with three differences: the set value is a target rate in seeds per metre (s/m), changed by 1; lines for the permitted deviation can be drawn above and below it; and skips and doubles are not counted.
“Precise” mode
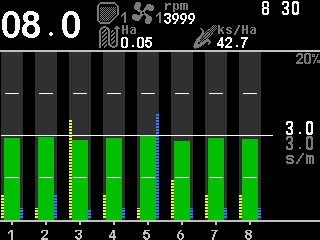
- Target rate — the lower figure of the rate field, in seeds per metre (s/m), changed by 0.1. While you change it, the panel also shows it as a population in ks/Ha and as the spacing between seeds in centimetres.
- Measured rate — the upper figure, averaged over the lines that have flow now.
- Rate line and the upper and lower deviation lines. Which of them are drawn is set by “Grid”: the rate line with “No” or “Full”, the deviation lines with “Partial” or “Full” (Seeding diagram settings). The permitted deviation is “Rate error,%” of the seed sensors.
- Green column — within the deviation; blue — above it; yellow — below it.
- Yellow hatched bar left of a column — the skips in that line; blue hatched bar right of it — the doubles. Their height is measured against “Scale S&D,%”, shown at the top of the rate field while “Skips & Doubles” is “Yes”. On machines with many rows the columns are too narrow and the bars are not drawn.
Skips, doubles and the quality are counted over the recalculation interval — the stretch of path set by “Recalculation,m” of the seed sensors.
Marks on a column — all modes
| Mark | Meaning |
|---|---|
| White box with ! | The sensor is taken out of control. |
| Red cross | No connection to the sensor. |
| Grey background, white number | The sensor selected in the sensor setup mode. |
| Light grey hatching | The line is shut off for a tramline — see Next tramline bout. |
“NOT UNDER CONTROL”
The panel starts watching the seeding alarms only when the drill is really seeding: when at least the share of lines set by “Percent of sowing,%” (20 % by default) sows within the set value — and, if “Seeding criteria” is set in the speed sensor, while the drill moves. Seed and fertilizer alarms start and stop together. One short beep says the watching has started; three short beeps, that it has stopped.
If the drill is seeding but the flow stays under the set value, the diagram shows “NOT UNDER CONTROL”. Either the flow has fallen during work — a real fault — or the alarm level or target rate is set higher than the machine delivers.
Something your machine does that this page does not answer? Write to support@agriwelt.com — an engineer answers.